
Setup Status & Alarm Page
The Status & Alarms page provides a central overview of the current operating status of selected building equipment. To ensure that faults, warnings, and operating states are reliably detected and visually displayed, system component must be created, relevant data points defined, and the desired messages correctly assigned. Once configured, the page automatically displays a summarized, color-coded assessment of the system status.
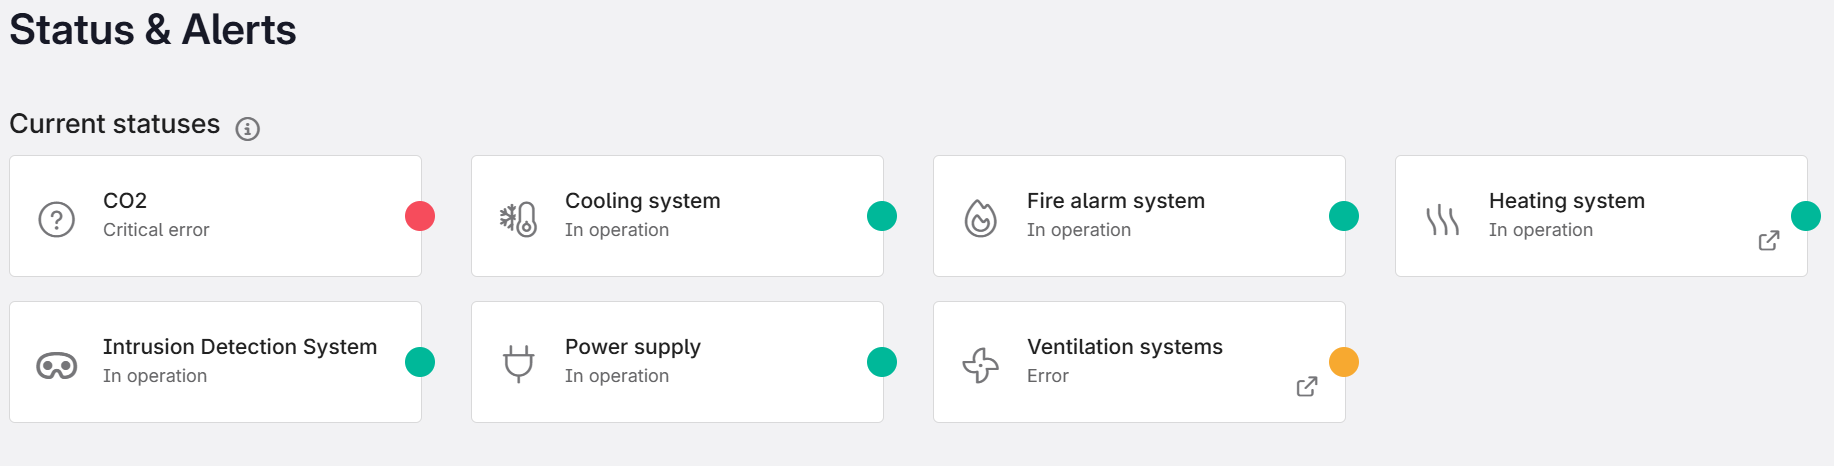
Figure 1: Overview of all configured statuses and alarms
A system is by default displayed in green. Warnings will appear in yellow and faults in red. To derive these signal colors clearly and automatically from measurement values, Virtual Data Points (VDPs) are used.
Status Codes and VDP Creation
The signal color of a status on the Status & Alarms page is based on fixed numerical values aligned with common API status codes. A Virtual Data Point (VDP) processes the measurement data from one or more input data points and translates them into a standardized status value, which is then displayed as the corresponding color on the status page.The following table shows which VDP value corresponds to which color and status:
VDP Value | Interpretation | Color |
|---|---|---|
100 | Normal operation | Green |
301 | Low-priority fault message | Yellow |
300 | High-priority fault message | Red |
0 | No data available or faulty configuration | Gray |
What Is a VDP?
A Virtual Data Point generates new information from existing measurement values which cannot be measured directly. Examples include:
• combining multiple sensor values
• converting units
• defining thresholds (e.g., green/yellow/red)
• logically linking alarm states
Creating a VDP
VDPs can only be created via the aedifion API. Important: Please note that there is a limit of 20 input pins per VDP. If more than 20 pins need to be combined in one VDP, one or more sub‑VDPs must first be created. These sub‑VDPs can then be combined into a higher‑level aggregation VDP (for aggregation, see the section “Aggregating Multiple Binary Alarms”). In general, it is recommended to work with sub‑VDPs when dealing with large numbers of input pins, as this makes it easier to identify and locate potential errors. A comprehensive technical description of VDP creation and the formulas used can be found in the official documentation.
The following sections describes the necessary steps and settings to create a VDP specifically for use on the Status & Alarms page. The creation is carried out via the following API endpoint:POST v2/project/{project_id}/virtual_datapoint
Required parameters:
Parameter | Data Type | Description |
|---|---|---|
project_id | integer | Numeric project ID |
dataPointID | string | Name of the VDP (e.g., RLT_alert-VDP) |
type | string | Drop-down menu with alvailable VDP types. Always select “formula” |
config | json | VDP configuration (formula + pins) |
description | string | Short description |
Tip: To create the config, copy one of the templates provided at the end and edit it in a JSON editor to avoid errors.
What Needs to Be Adjusted in the Templates?
In each template, only the following fields must be replaced:
- Formula → The calculation logic, depending on the use case
- dataPointID → The name of the actual input data point
Other parameters in the template, such as aggregate, data_range, or trigger, can remain unchanged. Information on how to modify them can be found in the technical documentation – however for the use cases described here, no changes are required.
Formula selection based on typical use cases
A detailed explanation of how to create calculation formulas can be found in the documentation under the section “Operators & Expressions.”
The following section focuses exclusively on how to create specific calculation rules for the Status & Alarms page. It is important to understand that different formulas are required depending on the type of input data point.
In general, three typical cases can be distinguished:
- Binary alarm values (0 = OK, 1 = Alarm or vice versa)
- Aggregated alarms, when several binary data points are combined into a collective status
- Non-binary measurement values with defined thresholds (e.g. temperature, CO₂, pressure)
Binary alarm values
Many systems provide binary signals, for example 0 = normal operation and 1 = alarm.
To translate this information into a status value that can then be displayed as a color on the Status & Alarms page, a simple formula is used:
r = 100.0; r = if(P1 == 1, 300.0, r);
Or, reversed, if 0 = Alarm and 1 = Normal operation:
r = 100.0; r = if(P1 == 0, 300.0, r);
Interpretation:
This formula defines a default value of 100 (green) and changes it to 300 (red) as soon as an alarm is present at the input pin (P1).
Note:
For purely binary alarm values, only the colors green and red are possible, since an intermediate step such as “yellow” does not exist technically.
Aggregating multiple binary alarms
If several sensors are to be combined into a common alarm status, an additional separate aggregation VDP can be created that logically combines multiple input pins.
In this case, it is important to ensure that the meaning of the alarm message is consistent across all inputs.
Case A: Alarm value = 1 for all inputs
If all data points to be aggregated operate according to the scheme 1 = Alarm, the max() function can be used:
max(P1, P2, P3);
Interpretation:
As soon as one sensor reports the value 1, the aggregation value is also 1 → the system is in an alarm state.
Case B: Alarm value = 0 for all inputs
Some signals operate according to the opposite principle:
0 = Alarm, 1 = OK
(e.g. some fault messages from fire detectors, pumps, or valves).
In this case, the min() function is used and the formula is slightly extended:
a = min(P1, P2, P3); r = if(a == 0, 1, 0); r;
Interpretation:
- If at least one value is 0 → aggregate = 1 (alarm)
- If all values are 1 → aggregate = 0 (no alarm)
This creates a unified binary aggregation VDP that returns 1 = alarm state and 0 = OK.
This aggregation VDP is then used as P1 in the actual status VDP as an input datapoint.
Thresholds for non-binary data points
Some measured variables do not only have “alarm/no alarm” states but continuous value ranges. Typical examples include CO₂ concentration, temperature, pressure, or power. In such cases, the three-level traffic light system can be used, which defines threshold values and generates status codes accordingly.
Example formula for a CO₂ concentration:
r = if(P1 >= 1500, 300, if(P1 >= 550, 301, 100)); r;
Interpretation:
If the value of data point P1 is:
- ≥ 1500 ppm → 300 (red, critical range)
- ≥ 550 ppm → 301 (yellow, warning range)
- below → 100 (green, normal operation)
Activating a VDP
After creation, the VDP must be started manually so that the values are calculated automatically and continuously. The start is triggered via the following POST endpoint:
POST /v2/project/{project_id}/virtual_datapoint/run
Required parameters:
Parameter | Data type | Description |
|---|---|---|
project_id | integer | Numeric project ID |
dataPointID | integer | ID of the VDP to be started |
run | boolean | true = start VDP, false = stop VDP |
To stop a VDP, use the same endpoint and simply set the run parameter to false.
Creating a status on the “Status & Alarms” page
After the Virtual Data Point (VDP) has been created and started, it can be used as a system status on the Status & Alarms page.
To do this, a system component must first be created and linked to the VDP.
Step 1: Create a system component
- In the left navigation bar, open Optimization → Components.
- Click New in the upper left corner.
- In the window that opens, select the System tile.
- Assign a suitable name to the new component, close the window, and reload the page.
- The component now appears as a tile on the Status & Alarms page – initially without an icon and with a gray signal color.
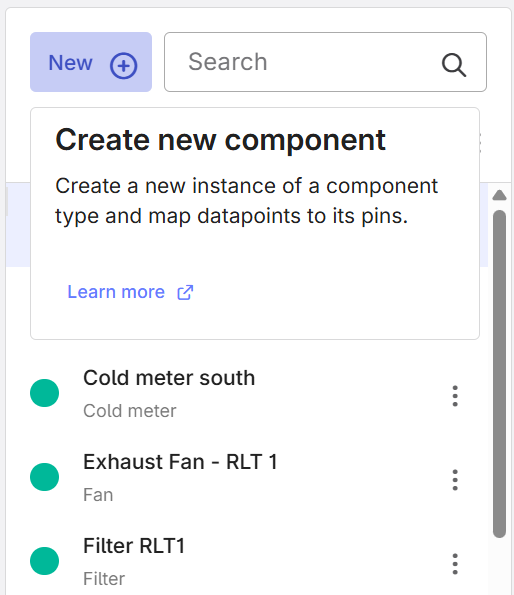
Figure 2: creating a new component
Step 2: Assign the VDP as operating status
- Open Optimization → Components again.
- Find the previously created system component in the overview.
- Open the component’s three-dot menu.
- Select Edit data points (Figure 3).
- A view opens with:
- a data point list and
- a field “Operating status” for the component.
- Find the previously created VDP in the data point list.
- Drag and drop the VDP into the Operating status field.
- Close the window in the lower right corner.
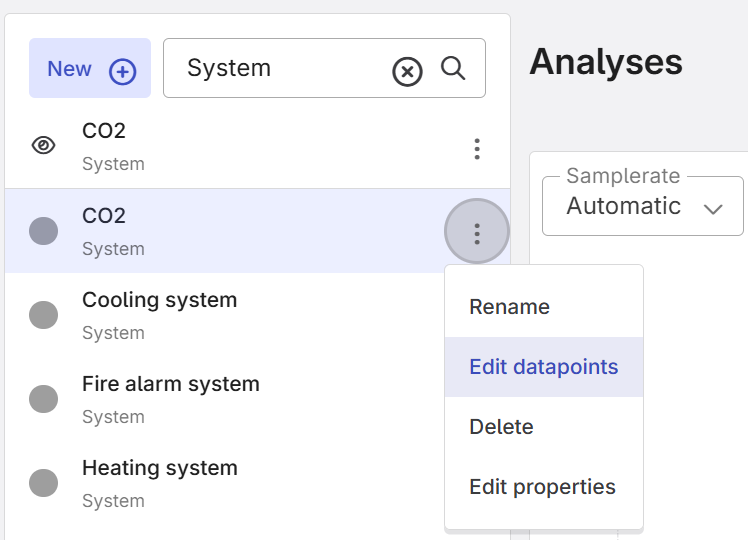
Figure 3: Editing data points via the component menu
Further information on mapping data points can be found via the info icon (i) in the Help Center at the bottom right or in the guide “Create and map a component.”
Step 3: Add an icon for the component
- Open the three-dot menu of the system component again.
- Select Edit properties.
- Choose a suitable icon and enter its name in the corresponding field.
Typical icons for HVAC systems, pumps, heat generators, etc. can be found in the table at the end.
VDP configuration templates
Below are three different templates for VDP configurations for the three discussed cases. Copy the desired template and edit it in a JSON editor. All templates create a VDP that automatically calculates a new value whenever the value of an input datapoint changes.
In each template, replace all example placeholders including the angle brackets (<>).
These are:
- the formula, matching the use case described above
- the dataPointID of the input data point
{
  "parameters": {
    "formula": "<r = 100.0; r = if(P1 == 1, 300.0, r);>"
  },
  "pins": {
    "P1": {
      "aggregate": "max",
      "dataPointID": "<AHU_alert_01>,
      "data_range": {
        "count": 1
      },
      "trigger": "every_value"
    }
  }
}
Template of a VDP config for a binary alarm datapoint.
{
  "parameters": {
    "formula": "<a = min(P1, P2, P3); r = if(a == 0, 1, 0); r;>"
  },
  "pins": {
    "P1": {
      "aggregate": "max",
      "dataPointID": "<Alarm_1>",
      "data_range": {
        "count": 1
      },
      "trigger": "every_value"
    },
    "P2": {
      "aggregate": "max",
      "dataPointID": "<Alarm_2>",
      "data_range": {
        "count": 1
      },
      "trigger": "every_value"
    },
    "P3": {
      "aggregate": "max",
      "dataPointID": "<Alarm_3>",
      "data_range": {
        "count": 1
      },
      "trigger": "every_value"
    }
  }
}
Template of a VDP config for the aggregation of three alarm data points in a single VDP
{
  "parameters": {
    "formula": "<r = if(P1 >= 1500, 300, if(P1 >= 550, 301, 100)); r;>"
  },
  "pins": {
    "P1": {
      "aggregate": "max",
      "dataPointID": "<CO2_measurement>",
      "data_range": {
        "count": 1
      },
      "trigger": "every_value"
    }
  }
}
Template of a VDP config for a status with threshold values.
Table with typical icons
System component | Icon |
|---|---|
HVAC |
|
Radiant floors |
|
Heating/Cooling circuit |
|
Chiller |
|
Cooling system |
|
Fire alarm system |
|
Power supply |
|
Ventilation |
|
Intrusion alarm |
|
Server |
|
Wi-Fi |
|
Battery |
|
Disabled emergency call |
|
Conference |
|
Elevators |
|
Diesel pump |
|
Water softening |
|
Lighting |
|
Gas warning system |
|
Main doors |
|