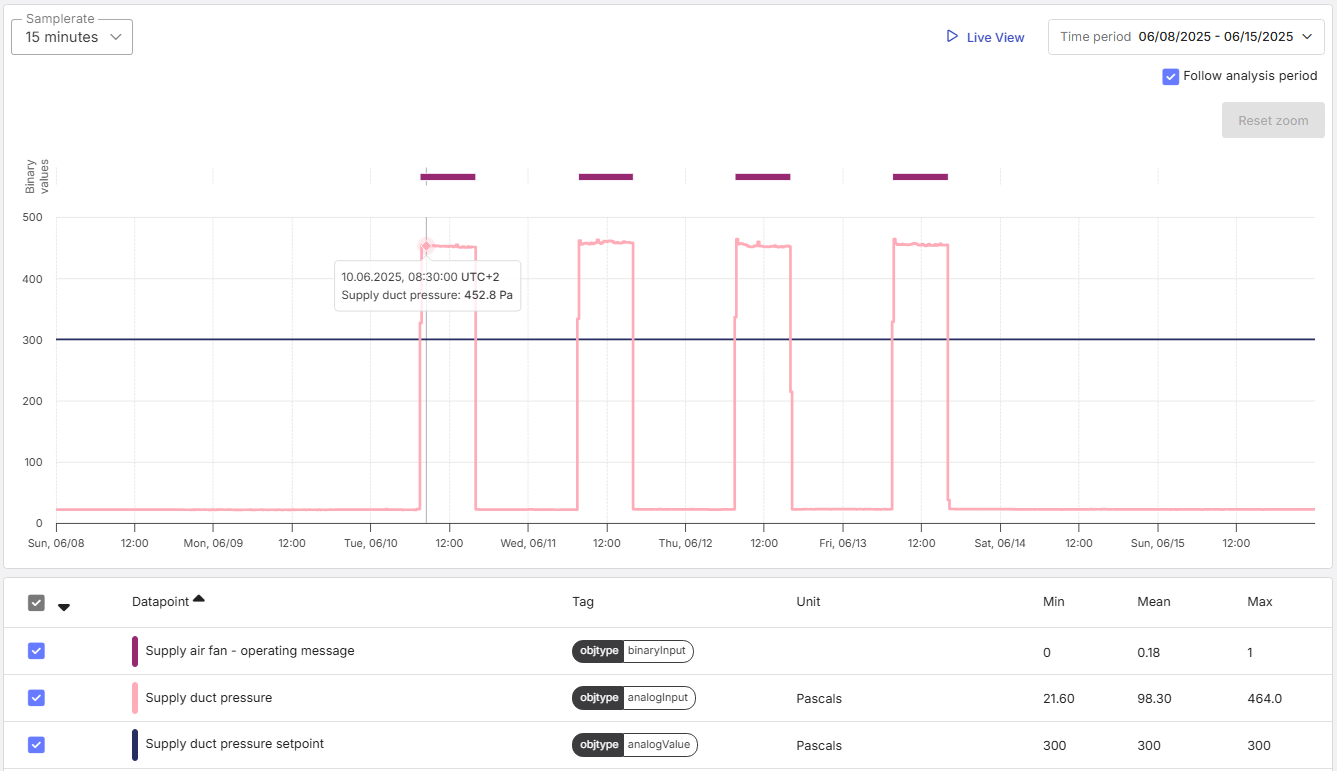
Savings potential with setpoint deviation of duct pressure
This section focuses on using the 'setpoint deviation' analysis for the air handling unit (AHU). In terms of the savings potential due to deviations from the duct pressure setpoint, the following pins are relevant:
- Return air duct pressure
- Return air duct pressure setpoint
- Supply duct pressure
- Supply duct pressure setpoint
Functionality
The 'setpoint deviation' analysis provides in general a comparison between the measured value and it's corresponding setpoint. In addition, the analysis provides an estimate of the potential savings if the pins 'Return air duct pressure' and 'Supply duct pressure' are analyzed and the actual duct pressure exceeds the setpoint. If the duct pressure exceeds the setpoint, the fan provides more duct pressure than necessary leading to an increased electrical energy consumption. The savings potential lies in reducing the duct pressure to match the setpoint. This scenario is illustrated in the following example.

Added value
- Identification of deviations between the duct pressure and the duct pressure setpoint
- Calculation of the savings potential by reducing the duct pressure to the setpoint
- Extrapolation of the savings potential to a calendar year
Prerequisites
- Mapping
In order to calculate the pressure deviation between the measured value and the setpoint, the duct pressure, the duct pressure setpoint and, optionally, an operating message must be mapped for the AHU. This is usually already done when setting up the components, provided that the necessary datapoints are available. - Information on the component's power
In order to calculate the savings potential, information on the power or volume flow of the supply and/or extract air fan must be available. At least one of the following must be defined:- Nominal power - fan (attribute)
- Nominal volume flow - fan (attribute)
- Volume flow - fan (pin)
- Adjustment of the attributes (optional)
Adjusting the attributes makes the analysis result and the calculated savings potential more accurate. Typically, at least the following attributes should be checked:- Energy prices: electricity, heat, cold
- Pressure setpoint deviation tolerance
Results
The following key figures are useful for interpreting the results of the analysis:
| Key figures | Example |
|---|---|
| operating time | 33,83 h |
| supply duct pressure.actual value.mean | 452,8 Pa |
| supply duct pressure.setpoint.mean | 300,0 Pa |
| supply duct pressure setpoint deviation.duration.above threshold | 33,64 h |
| supply duct pressure.Supply fan. reduction factor.mean.energy.electricity | 34,08 % |
| supply duct pressure.Supply fan.savings potential.energy.electricity | 171,2 kWh |
| supply duct pressure.Supply fan.yearly savings potential.energy.electricity | 8929 kWh |
| supply duct pressure.Supply fan. yearly savings potential.financial.electricity | 1429 € |
| supply duct pressure.Supply fan.yearly savings potential.CO2 emissions.electricity | 2741 kg |
