
Available analyses
Analyses are the central tool for determining the condition of individual components in your building. They operate in several steps: first, all available data is automatically collected, structured, and assigned to the respective components. Then, individual analyses can be configured and performed for each system or component, providing concrete recommendations for operational optimization.
The results of each analysis are clearly and consistently structured so that you can quickly grasp the most important information:
- Traffic light rating: (red/yellow/green) for quick assessment of urgency
- Interpretation: short statement describing the current situation
- Concrete recommendations for action: suggestions for meaningful optimization measures to improve system operation
- Key performance indicators: for detailed insights
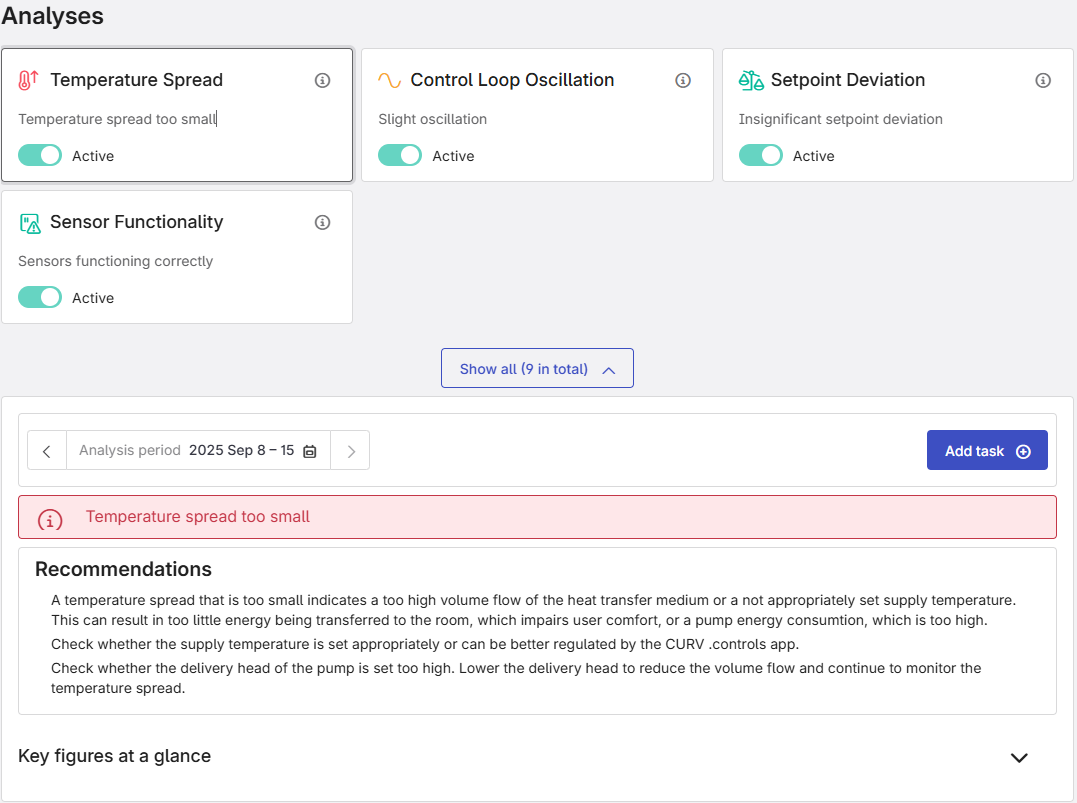
Figure 1: Activated analyses including one result
For more information about the analysis results, see the article “Analyses & Recommendations” in the Help Center.
Alarm State
The Alarm State analysis assesses the occurrences and duration of alarm messages of a component. It is particularly useful for notifying the user when alarm messages have been overseen, as it summarizes the alarm messages over a given time period. Additionally, the Alarm State analysis considers the most recent alarm message to determine whether the error has been resolved. While this analysis can be used for all alarm messages, it is most suited to critical alarm messages.
CO2-Emmisions
The CO2 Emissions analysis summarizes the CO₂ emissions resulting from the energy consumption recorded by the building’s metering components during the analysis period. The CO₂ emissions are related to the building’s net floor area and compared with the typical emissions of comparable building types.
Control Loop Oscillation
The Control Loop Oscillation analysis checks the process value of a control loop for oscillation. Oscillating process values are an indicator for suboptimal parameterization or structural dimensioning of the control loop.
Control Sequence
The Control Sequence analysis determines the operating modes of a system and compares these with predefined reference modes. The reference modes consist of normal (allowed) operating modes such as heating or dehumidification and faulty (not allowed) operating modes such as simultaneous heating and cooling.
Dew Point Alert
Building automation systems often have dew point alert messages which identify the possibility of unwanted condensation taking place in rooms. If the dew point alert message is active for any amount of time during the period of analysis, a recommendation is made to the user since condensation in rooms can be damaging. Furthermore, if the temperature and relative humidity of the room are known, the Dew Point Alert analysis calculates the risk of condensation and takes these into account in the evaluation. The Dew Point Alert analysis is recommended for any room with an existing dew point alert signal or with temperature and relative humidity sensors.
Dynamic Control
The Dynamic Control analysis evaluates whether a technical component is controlled dynamically. For example, it examines whether a fan is dynamically regulated depending on the operating condition or whether it operates at a constant speed. This helps identify control issues and ensures that components operate more energy-efficiently.
Elevators Operating Time Analysis
The Elevators Operating Time analysis aggregates all operating states of elevators and calculates total operating time and overall availability. All elevators in one project will be taken into account with this analysis. The analysis is based on aedifion operating states.
Energy Consumption
The Energy Consumption analysis aggregates all energy consumptions indicated by the meter components in the building during the analysis period. The total energy consumption is related to the net floor area of the building and is benchmarked against the usual consumption of the same type of building.
Energy Cost
The Energy Cost analysis aggregates all energy costs indicated by the meter components in the building during the analysis period. The energy costs are related to the net floor area of the building and are benchmarked against the usual costs of the same type of building.
Energy Efficiency
The Energy Efficiency analysis evaluates the quality of the energy conversion of a component, based on efficiency indicators. It is useful to detect inefficient operational states. Furthermore, information is provided regarding which part of the plant is responsible for the malfunction and what could be done to resolve the problem.
Filter Servicing
The Filter Servicing analysis predicts when a filter is due to be serviced or replaced, based on filter contamination or the pressure difference over the filter. This ensures that filters always function optimally and are maintained or replaced as required.
Flexible Tariff
The Flexible Tariff analysis determines the potential electricity cost savings of a flexible electricity tariff compared to a fixed electricity tariff. The analysis evaluates the potential savings based on the electricity consumption profile during the analysis period. Therefore, the potential is evaluated purely through a tariff change without any assumption about the flexibility of the consumption profile. The flexible electricity tariff consists of a static and a dynamic part. The saving potential is the difference between the actual electricity costs and the costs of a flexible tariff.
Heat demand
The heat demand analysis consolidates all billing-relevant heat energy meters to calculate the total heat demand of the building. The algorithm establishes a correlation between the heat demand and the outside air temperature of the building. The objective is to create a mathematical model that estimates the heat demand based on the outside air temperature. The base load energy, such as water heating, is calculated separately. The analysis compares the current analysis period with a reference period to calculate energy savings.
Heat Pump Investment
The Heat pump investment analysis is an extension of the heat demand analysis with a heat pump simulation and an economic efficiency calculation.
The user can vary the boundary conditions of the physical and monetary domain to check if a heat pump is economically feasible for the heating system.
An electric heating element is assumed as an additional part of the heating system. Its electrical energy consumption is taken into account in the calculation of the annual coefficient of performance. The electrical energy is assumed to be equal to the thermal energy.
Humidity Conditioning
The humidity conditioning analysis compares the humidity of the outdoor air with that of the supply air in a ventilation system. From this, periods of humidification and dehumidification are identified. In addition, the analysis identifies periods when humidity conditioning would not have been necessary and determines the resulting savings potential. It should be noted that the analysis does not take into account humidity recovery or air recirculation. Therefore, to obtain meaningful results, the analysis should only be performed for periods when these operating modes are inactive.
Limit Violation
The Limit Violation analysis identifies and evaluates limit violations of component pins. There are three types of limit values: upper limit, lower limit and tolerance band. The tolerance band is the combination of an upper and a lower limit. Lower and upper limits can be specified by pins or attributes. For attributes, the limit value is a fixed value, but for pins, it can change during the analysis period. Only limit violations that occur during operating time are assessed.
Operating Cycle
The Operating Cycle analysis identifies excessive start and stop processes which lead to energy losses, energy consumption peaks due to higher energy consumption on plant start, and higher wear-and-tear of the component compared to a constant operation. Further, a frequently alternating operation of a component, e.g., a heat pump, has negative effects on adjacent components, which are enforced to alternate as well. Further, the algorithm takes low cycle rates as an indication of a possible under-supply of the adjacent systems.
Reduced Load
The Reduced Load analysis identifies the presence of a reduced load mode based on temperature setpoints of the system under consideration. A reduced load mode offers the possibility of operational cost and energy reductions. Recommendations are made to implement a reduced load mode if it is not detected or only results in small changes to the temperature setpoint. Moreover, the analysis checks if there is a correlation between the temperature and the outdoor temperature which indicates the precence of a heating curve. If no heating curve is detected, the recommendation is to implement one. Additionally, a comparison with a user-defined schedule reveals times when the component could be in a reduced load operating mode.
Room Air Quality
The Room Air Quality analysis checks and interprets the measured CO2 concentration in a room and calculates a continuous air quality index ranging from 0% (low air quality) up to 100% (high air quality). If the air quality is poor, measures to improve it are recommended.
The algorithm also detects and automatically corrects calibration errors in the measured CO2 values. In general, human performance is affected by air quality and a lower performance can be expected when air quality is low.
Schedule
The Schedule analysis is used to compare the actual occurred switch on/switch off times of the component with a stored schedule/timetable. This analysis aims at identifying the number of hours the component is active outside the scheduled times and the potential savings of implementing a schedule. In addition to a one-time check, the analysis is suitable for permanent checks, e.g., to identify manual overwriting of the operating schedule. The analysis considers holidays and customized schedules.
Sensor Functionality
The Sensor Functionality analysis uses the time series data of the sensor to detect irregularities of observations. This implies manual overwriting of the sensor values, constant observations for expected volatile trajectories of the data points' observations, and also value plausibility checks by types of sensors.
Setpoint Check
The Setpoint Check analysis identifies and evaluates the deviations of setpoints from their optimal setpoint values. A setpoint deviates from its optimal setpoint as soon as the values differ without a tolerance being applied. The optimal setpoints are defined by attributes.
Setpoint Deviation
The Setpoint Deviation analysis identifies setpoints that are not met by their process values. The difference between the setpoint and the actual value is also known as the setpoint deviation. A high setpoint deviation is a symptom that can be traced back to many causes. E.g., the insufficient supply of a controlled system with the required temperature level, suboptimal controller software, and parameters, or a blocked valve. The Setpoint Deviation analysis incorporates features that help to narrow down the root cause of a high setpoint deviation, such as setpoint deviations caused by upstream components. The analysis is able to estimate a savings potential for the air handling unit (AHU) if the supply/return air duct pressure exceeds it's setpoint.
Setpoint Plausibility
The Setpoint Plausibility analysis identifies implausible setpoint values for common application of a component. This is achieved by identifying periods for which the setpoints fall outside predefined limits.
System Control
The System Control analysis detects whether the operation of the analyzed components is synchronized correctly. E.g., the pump of a thermal control loop is operating while the 2-way valve is closed or rather almost closed. If pumps continue to be operated with the valve closed, this leads to unnecessary power consumption and higher wear of the pump due to the additional running time. A valve opening of 5 % or less is considered as closed.
Technical Availability
The Technical Availability analysis aggregates all system components in the project in order to determine the over all technical availability. The calculated KPIs of the analysis are related to the operating states of the system components.
Temperature Adjustment Savings
The Temperature Adjustment Savings analysis estimates the yearly savings potential in one entire building for measures that influence the room temperature. It uses the energy consumption during the reference period to estimate the specific energy consumption per degree-day. The savings are caluclated for a typical year based on the reference period. Moreover, the analysis extrapolates the savings potential into the future by comparing the reference period to the analysis period. The adjustment is calculated between the room temperature that is measured or given as an attribute and the optimal room temperature derived from the outside air temperature. The optimal temperature is either a user input or derived automatically from the measures that are set in the project. At the moment we can seperate between heat energy, cold energy and electric energy.
Temperature Efficiency
The Temperature efficiency analysis determines the thermal efficiency of a heat recovery system and compares the efficiency to a reference value. These reference values can be derived from industry standards or the data sheet of the air handling unit. Low temperature efficiency values may indicate fouling or an overall bad quality of the heat recovery process.
Temperature Spread
The Temperature Spread analysis assesses the temperature difference between a supply and return temperature sensor of a heat or cold distribution system during the system's operation. It is proportional to the thermal output transferred to the consumer. While a small temperature spread indicates the potential for volume flow and therefore pump power consumption reduction, a huge spread indicates thermal under supply of the downstream systems and consumers.
Thermal Comfort
The Thermal Comfort analysis quantifies the thermal comfort of a room on a scale of 0-100%. First, the comfort temperature is defined for the room according to DIN EN 16798-1. This comfort temperature depends on the outside air temperature. The analysis then calculates the spread between this comfort temperature and the actual temperature of the room. Finally, the spread is converted to a percentage of thermal comfort.
Virtual Meter
The Virtual Meter analysis determines the amount of electrical power, gas, heat, and water which is measured by meters or used by other components. If meter data is not available, other data sources like power can be used to infer the consumption.
When heat or cold meters are analyzed, the temperature difference and volume flow are used to calculate the "virtual heat" which is compared to the "measured heat" if the required pins are available. The Virtual Meter Analysis substitutes physical meters and enables energy/resource flow tracing.
Weather Station
Two important sensors for HVAC system control are the outdoor air temperature sensor and the outdoor air humidity sensor. Many control decisions, e.g., what amount of heat/humidity is to be provided, and the switching between heating and cooling modes, are made based on the measured outdoor temperature and humidity. The sensors are prone to wear out over the lifetime of the building. Furthermore, the sensors are often influenced by solar radiation or heat emitted from components in its surrounding. Wrongly measured outside air temperature or humidity directly corresponds to a thermal over/under supply of the building or incorrect indoor humidity, often leading to poor user comfort and increased energy consumption.
The Weather Station analysis identifies installation errors and measurement offsets of the outdoor air temperature sensor and derives optimization measures for better outdoor air temperature measuring.
Wellbeing
The Wellbeing analysis aggregates thermal comfort and room air quality for several/all Room components in the project in order to estimate the overall indoor wellbeing of users of the building. Thus, this is an analysis of the component building.
Depending on the available sensors on room level, the analysis will determine the most accurate wellbeing estimation possible and adjust its benchmarking.