Component mapping
The component mapping section consists of all the functionalities you might need to add and edit components in your project.
Copy an existing component
To copy an existing component: 1. click the "Copy an existing component" in the main menu. 2. select the component from the project which needs to be copied. 3. enter configurations for the new components.
Change attributes for multiple components
This function has the ability to change multiple components' attributes from the same component type.
To change attributes for multiple components: 1. click the "Change attributes for multiple components" in the main menu. 2. select the component type. 3. select component(s). 4. enter new attribute values. To override existing values check the bottom checkmark. 5. click apply
Create a batch of new components
To create a batch of new components: 1. click the "Create a batch of new components" in the main menu. 2. select component type 3. enter components configurations.
Cluster datapoints into components
With the powertools you can create components on the aedifion platform using patterns in the project's datapoints. It is called clustering and will interactively guide you through the process of creating clusters, refining them and finally transforming them into usable components.
It consists of four distinct steps.
- You load all datapoints from your project and select some initially known components. You can adapt the clustering parameters individually for your project. This initial step will create a course clustering which can be refined in the next step.
- You now can refine your clustering if the initial clustering from step 1 did not create the desired result. You can merge multiple clusters into larger ones, rename existing clusters or add missing datapoints to clusters.
- Create components from those clusters by assigning a component type and mapping datapoints to the pins of the components. By replicating mapped components, you can easily duplicate a mapping from one component to multiple similar components.
- In the final step you can either export the clustering to an XLS file or a folder for further processing or directly write the created components to the server.
Delete components
The existing compontents can be deleted with the delete components field.
Set up building and frontend pages from Excel
To set up the web frontend, click the "Set up building and cockpits from Excel" button in the main menu. Be aware that the dryrun mode is active by default. This means that you will only be able to download data and not push your settings to the frontend. If you want to exit the dryrun mode, go to the main menu and click "Change connection configuration", and set the dryrun mode to inactive.
🔥 Tip |
To set up building and web frontende from Excel, the user needs to import the Excel file with all the necessary data. To build your Excel file, use the template provided by clicking the "Save template" button. |
Asset Overview
The asset overview (asset cockpit) in the web frontend is a high level view of the building component and connected analysis functions. Only a selection of attributes and analysis is shown in this cockpit. The process to set up these attributes and functions is shown below.
Asset Overview Excel Setup
We can configure the Asset Overview with the help of the Excel configuration file. The building below shows the Excel view to the Asset Cockpit below.
Building Goals
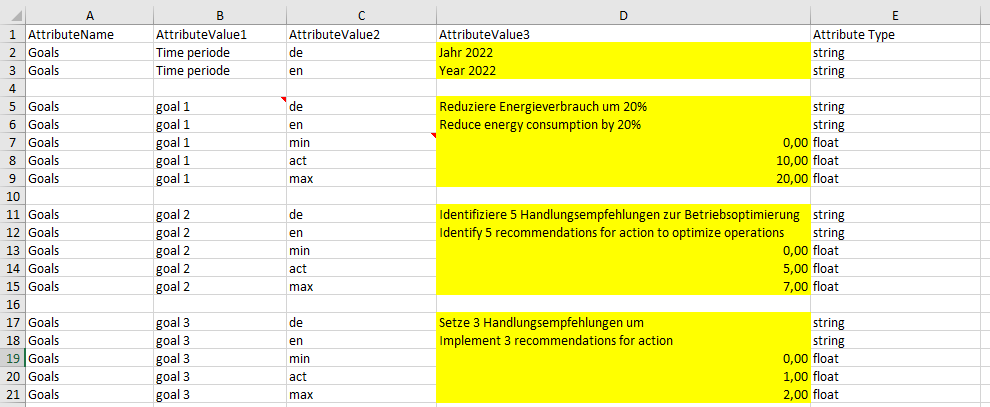
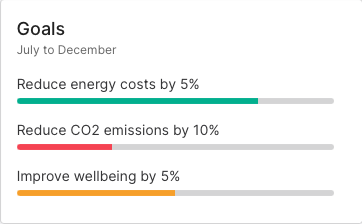
- Just copy a complete block of goal X (de, en, min, act, max) for a new goal or delete unnecessary goals
- Generally it's better to delete rows that would be empty than keeping them
Energy costs and CO2 emissions
The Excel sheet contains a table to set up meter components for the Asset Overview calculations of Energy costs and CO2 emissions. These analysis functions are based on meter components.
Currently, we support the following meter components:
| AlphanumericID | Component | Energy type | Datapoint | Information |
|---|---|---|---|---|
ELM | Electricity meter | Electricity | Energy pin in kWh |
|
HM | Heat meter | Heat (Wärme) | Energy pin in kWh |
|
CM | Cold meter | Cold (Kälte) | Energy pin in kWh |
|
GASM | Gas meter | Natural gas | Gas volume pin in m3 | Pin is in m3, but cost and CO2 factor are per kWh! |
- Always pick unique names for meter components, so that the powertools can distinguish them
- Energy price is used to calculate energy costs (always in €/kWh)
- CO2 Factor is used to calculate CO2 emissions (always in kg CO2/kWh)

Asset Cockpit custom limit values
- The limits are used to “benchmark” the summary KPI of the result and determine the signal color as well as the benchmark plot
- Currently, only the limits for energy-related analysis functions can be changed in the Building component
Add Asset-Cockpit to project
After configuration of the additional building information as well as the meter table you can run the powertools to set up the Asset Cockpit.
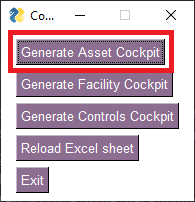
After successfully loading all data into the project you still need to go to the building component (Optimization->Compontent in the web frontend) and activate analytics functions you want to run (in this case Energy costs and CO2 emissions). Now you can run the analysis functions for the months you want to display on the asset overview.
- Execute analysis functions on whole months start: 2022-01-01, end: 2022-02-01
- Execute always in timely order, from historic to more current month or the month comparison will not be calculated correctly
- If a mistake appears, and you need to correct data, it's best to delete the instances for the analysis functions and start over again

Wellbeing
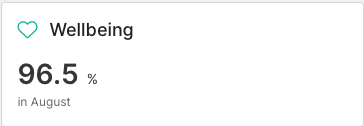
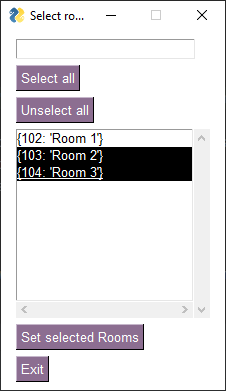
The wellbeing overview in the front end only shows valid results for a building, if at least one room has the attribute "ROOM+CALC_SATI" set to True. You can easily do this for multiple rooms using the "Add Rooms to Wellbeing" button within the "Generate Asset Cockpit" function of the powertools. After downloading all the buildings rooms and checking their attributes (this might take a few minutes for buildings with a large number of rooms) his will open a new window. There you can see a list of all rooms, with an indication of which rooms have already been activated for wellbeing. The previously activated rooms will be shown as selected with a blue background. You can activate or deactivate rooms by selecting them and then pressing the "Set selected Rooms" button. This way, you can add all or only a selection of rooms to the wellbeing analysis.
Technical availability
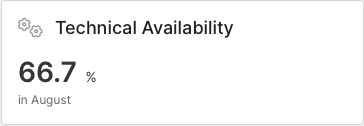
- Setup of the technical availability is straight forward, because it uses the system components and datapoints created for the facility cockpit.
- Before you run this function, it's best to set up the Facility cockpit (see below).
- It's also recommended to calculate historic values for all VDPs (virtual datapoints) of the system, because this analysis function will run on historic data over a period of a month.
Status and Alerts
The Status and Alerts view if the frontend consists of current statuses, which are based on system components, and incidents, which are the alerts set in the building component
Current statuses
Required: Running FLOT instance
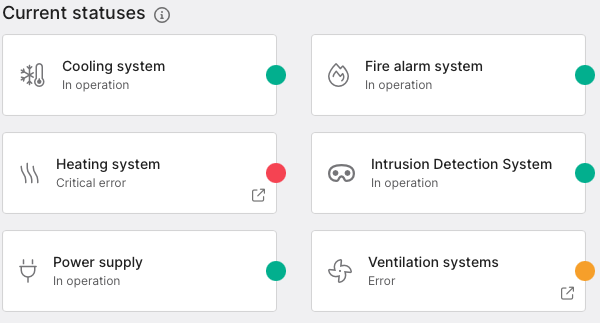
Current statuses are based on the values pinned to the system components. The pinned datapoints have to be Status-VDP, since the frontend only works as expected if the datapoint´s values are the specific values in the following table:
| Value | Status light color | Meaning in the frontend | relevant keyword in the Excel |
|---|---|---|---|
0 | ⚫ grey | The machine is switched off or there is no data to show | on_message |
100 | 🟢 green | The machine is running | operating_message |
102 | 🟢 green | The machine is currently shut off, but ready to turn on | [automatically set] |
103 | 🔵 blue | The machine has a smaller warning, such as a filter-changing message | non_critical_messages |
200 | 🟢 green outline of a circle | The machine is turned off manually | manual_switch_off |
300 | 🔴 red | The machine has a large problem, causing it to be in a fail state | error_messages |
301 | 🟡 yellow | The machine has a large problem, that did not cause it to be in a fail state | low_prio_error_messages |
To add these, you have to first make sure that the Stream Processing (Flot) is running for the project. You can easily check, by requesting the GET /v2/project/{project_id}/virtual_datapoints endpoint for your given project. If the response looks like this, please contact us.
{
  "error": "Requested resources do not meet sufficient requirements. * Event streams are currently not available for project id '1'. To enable this service for the project, please contact support@aedifion.com. ",
  "operation": "",
  "success": false
}
If Flot is running, you can add VDP to the project, add system components and pin one to the other. This is easily achieved by using the VDPs and FacilityCockpit worksheets in the powertools Excel template.
Adding VDPs
The VDPs worksheet is easy to fill out. Here is a small example (comment and description columns removed for brevity)
| vdp_name | bms_datapoint | message_type | normally_open |
|---|---|---|---|
AHU-OS-VDP | fan-on-BI123 | operating_message |
|
AHU-OS-VDP | pump-on-BI213 | operating_message |
|
AHU-OS-VDP | machine-running-when-value-is-1-BI312 | on_message |
|
AHU-OS-VDP | change-filter-BI321 | non_critical_messages |
|
AHU-OS-VDP | show-error-when-value-is-1-BI132 | error_messages |
|
AHU-OS-VDP | show-lowprio-error-when-value-is-0-BI132 | low_prio_error_messages | FALSE |
|
|
|
|
Heating-OS-VDP | error-BI456 | error_messages |
|
Heating-OS-VDP | error-BI465 | error_messages |
|
Heating-OS-VDP | error-BI654 | error_messages |
|
|
|
|
|
Cooling-OS-VDP | system-running-BI789 | operating_message |
|
Cooling-OS-VDP | operator-manual-shut-off-BI798 | manual_switch_off |
|
Cooling-OS-VDP | system-running-BI987 | operating_message |
|
|
|
|
|
Heating-and-Cooling-OS-VDP | Heating-OS-VDP | combined_status_messages |
|
Heating-and-Cooling-OS-VDP | Cooling-OS-VDP | combined_status_messages |
|
Message types are here to categorize the datapoints based on their intended usage:
🔥 Tip |
All bms_datapoint values should be either 0 or 1, since this tool converts binary states into a usable and standardized VDP |
- on_message: datapoint shows whether the system is off (Resulting VDP Value=0)
- operating_message: datapoint shows whether the system is running (Resulting VDP Value=100) or currently not running (102)
- non_critical_messages: for datapoints that might be important to the FM, but are not critical, like a warning to change the filter (103)
- manual_switch_off: datapoint indicates that the system has been manually switched off (200)
- error_messages: datapoint indicates a system error that is critical, leading to system-shutdown (300)
- low_prio_error_messages: Error message that warrants a closer inspection but does not shut down the entire system, e.g. one of two pumps shut off (301)
- combined_status_messages: Combine two or more VDP into one. The resulting value will be the maximum of all VDP (except 300 trumping 301)
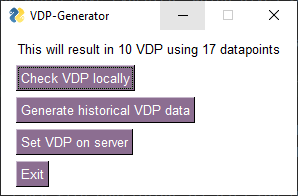
Once you´re finished filling out the Excel sheet, you can activate the VDP on the server. Click "Generate Facility Cockpit" and then "Generate VDP" to reach the VDP-Generator. Here you have the option to calculate and check the data locally, to immediately set the VDP on the server and to generate historical data. It also gives you an indication of how many VDP you will be adding to the server and how many datapoints those are using. At this point, you might want to check, whether the current project license allows for the amount of additional VDP. The standard license has a maximum of 100 VDP, but there may already be VDP on the server, so check this before trying to add more.
⚠️ Warning |
Since unvalidated VDP might contain datapoints that are not binary or are not correctly identified as normally-closed, the resulting VDP data might be incorrect. Always check your VDP locally before setting them on the server to avoid having to delete them. Also, always upload historical VDP data to the server before setting the VDP. Setting VDP and then uploading data has in the past lead to many difficulties, because of data-type issues when adding new data to existing VDP. You can easily avoid those by uploading the data before setting the VDP! |
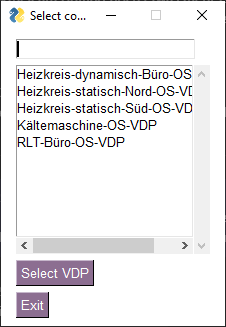
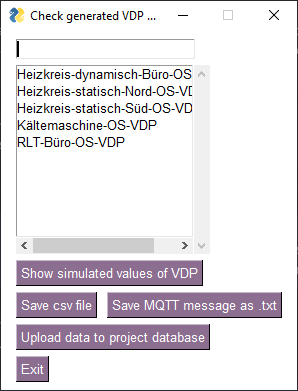
If you want to check your VDP before setting them on the server, choose "Check VDP locally". The program will then download all relevant data for the last seven day from the server and calculate the VDP values. (This might take a few minutes, if your VDP use a lot of datapoints!). After this is finished, the VDP selection window will pop up. This lists all the most top-level VDP (VDP that are not used within other VDP, such as combined_messages, or automatically generated combining VDP). By selecting one and clicking "Select VDP", you can plot it´s behavior from the last 7 days.
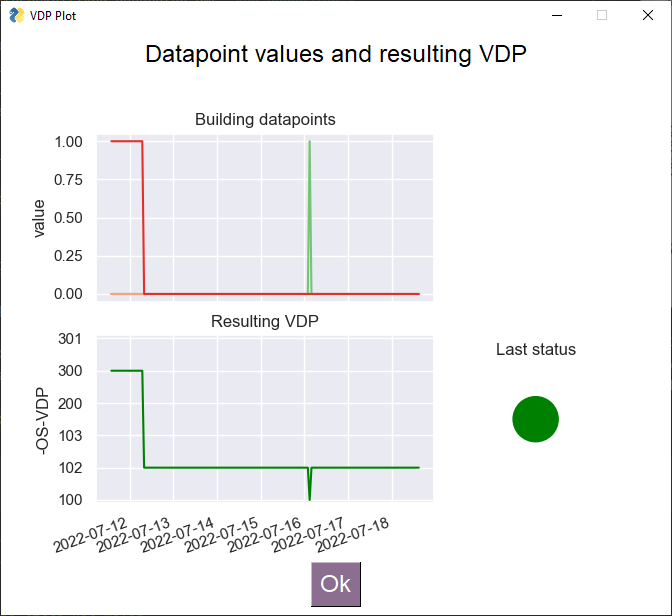
This is an example for a VDP plot. The upper plot shows the datapoints that will be combined into this VDP. They are already grouped by color, so you can easily differentiate between which datapoints are relevant for the operating_messages (green), the error_messages (red) and all others (yellow). The lower plot shows the resulting VDP´s behavior. You can check, whether the VDP is behaving as you would have expected, which gives you a chance to correct errors, such as wrong message types, or incorrect normally_open associations. If everything is behaving as expected, feel free to set the VDP on the server. If not, make the necessary changes in the Excel and import it again to check your changes.
Additionally, you can check and upload the last three months worth of VDP data, so that you can immediately start running analytics on your system components for the last three months. The "Check VDP locally" works the same way as the "Grab data from server and calc VDP locally", but you can check a larger timeframe and save the data, or even immediately upload it to the server.
If you choose "Save csv file", you can download a csv file containing all data for the top-level VDP and the latest values of intermediate VDP, so that all VDP have all data available when they are freshly set up. You can then upload this data using the importTimeseries endpoint.
If you choose "Save MQTT messages as .txt", you can download a txt file containing all the same data as the csv file, but this version of the file is already formatted correctly as an MQTT message. This way, you can upload data in projects where the API upload might be causing problems, e.g. because of its automatic conversion to float values.
If you choose "Upload data to project database", the data will be uploaded completely automatically using the importTimeseries endpoint.
(Be advised, that you might have to do this before adding the VDP, since currently there are problems since these values are calculated as float, but the server calculates values as integer.)
Once you´ve uploaded the data, feel free to set the VDP on the server. If you set the VDP on the server before uploading historical data, uploading historical data becomes very difficult, since the influx might set incompatible units. Also, this might lead to a problem with the new VDP, since they might be set out of order and therefore VDP that rely on other VDP might not get initial data and have to be manually stopped and restarted. To avoid both these cases, always upload historical data before setting the VDP!
Adding System components to status and alert view
Once the VDP have been added to the project, you can add system components and pin the VDP to them. The Excel template and powertools help you out there too. You only need to fill out the Systems table in the FacilityCockpit worksheet for the powertools to do the rest of the work for you. An example of system components based on the VDP from the previous section:
| NameDE | NameEN | DataPointID | Icon |
|---|---|---|---|
RLT Anlagen | AHUs | AHU-OS-VDP | fal fa-fan |
Heizen und Kühlen | Heating and Cooling | Heating-and-Cooling-OS-VDP | fal fa-air-conditioner |
- NameDE and NameEN: the names that are set in the frontend as the names for the system components
- DataPointID: These DataPointIDs should be binary-state-converting-VDP (such as those generated from the VDP worksheet), since the analytics functions that run on system components expect values between 100 and 301
- Icon: Icons that are shown together with the name and colored light in the facility cockpit. Any icon from fontawesome will work here.
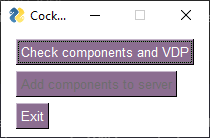
To add the system components and pin the VDP, click the "Generate System components and map VDP" button. This will open a new window, where at first your only valid option is to check the components.
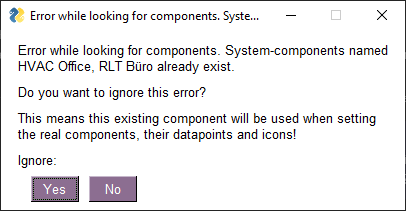
If you start the check, a script will run that checks, whether the names for the system components are already been used, or whether the VDP have been set correctly. If a problem occurs, the script will show a pop-up. By choosing yes when a problem with system component naming occurs, the script will automatically use the existing system component as a target and pin the VDP to it.
If the check runs without errors or all errors have been ignored, the "Add components to server" button will be available for you to press. Since you have now checked the VDP and System components, you can click this button and finish setting up the system components.
Additionally, an error might pop up after all system components have been set, that warns you of system components that are not in the Excel sheet. These can be either left over from different iterations of the same Facility Cockpit, where you renamed the component, deleted an unused one from the Excel but not from the server, or because you manually set one in the frontend. This error lists all system components that are not in the list in the Excel sheet, and allows you to delete them all with a single click of a button. If you want to keep them or only want to delete some of them, click No and take care of it manually in the frontend.
Your system components should now be visible in the Facility Cockpit. If all status lights are grey, you might have added more than 10 system components, which can cause a problem in the current version of the Frontend. The quick fix for this is to upgrade the maximum number of datapoints that are allowable to download at once using the project/timeseries endpoint to be larger than your number of system components.
Incidents
Incidents are the alerts that can be added to single or multiple datapoints. They will show up in the Facility Cockpit as active and can also send alert emails, if you set them up that way. The alerts you can set here are threshold based, so they will go off if a value has been over- or understepped.
Required: Alerta alarm dashboard incl. customer lookup entry in Alerta - Alerta alarm dashboard: Add {"alarm_dashboard":{"customer_name":"\"}} (Replace \ with the exact name of the company) to adminer to field "config" of table "company" (VPN, adminer access needed) - Customer lookup entry in Alerta: Login to Alerta (alert.) with realm admin account. Open menu , open "customer", click
 (bottom right) and add new customer lookup by entering the exact same company-name as in the alarm dashboard to field "customer" and their e-mail domain (e.g. aedifion.com to enable Alerta access for this company for all aedifion users). Add lookups for all user e-mail domains required for the specific project. (VPN, realm admin credentials needed) - Configuring Alerta is tricky and often leads to errors. Thus, check success afterwards setting up incidents (see below) by causing an alarm state in one of the incidents (e.g. by csv upload of observations via our API) and see, if incident card switches to alarm state. In case it doesn't, double-check the Alerta configuration before you involve our backend-dev team.
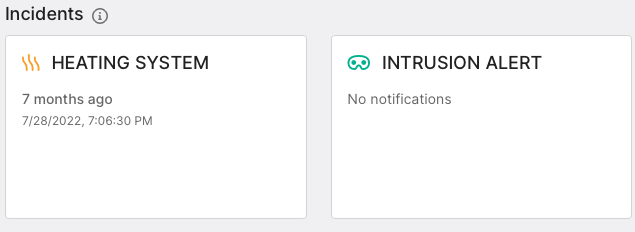
If you want to add the threshold alerts, fill out the Excel sheet accordingly. If you want to combine multiple datapoints or value ranges of a single datapoint (or both) into one alert, just add multiple lines containing the identical "NameDE", "NameEN" and "Alert Category", and fill out the other columns according to your preferred alarm. Rows that contain identical names and alert categories will be automatically combined into one incident in the frontend, but may still result in multiple alerta alerts.
Here is an example of alerts in the Excel sheet, based on the status VDP mentioned previously, plus additional examples:
| NameDE | NameEN | DataPointID | Icon | Alert category | threshold_crit | threshold_dead | threshold_ok | threshold_order |
|---|---|---|---|---|---|---|---|---|
RLT Anlagen | AHUs | AHU-OS-VDP | fal fa-fan | ahu | 250 | -1 | 220 | asc |
Heizen und Kühlen | Heating and Cooling | Heating-and-Cooling-OS-VDP | fal fa-air-conditioner | heatingcooling | 250 | -1 | 220 | asc |
Feuermelder | Fire alarm | firealarm-BI123 | fal fa-fire | fire | 1 | -1000 | 0 | asc |
Bürotemperatur | Office temperature | office-temp-AI321 | fal fa-thermometer-half | officetemp | 25 | -1000 | 24 | asc |
Bürotemperatur | Office temperature | office-temp-AI321 | fal fa-thermometer-half | officetemp | 18 | 1000 | 20 | desc |
- NameDE and NameEN: the names that are set in the frontend as the names for the alerts
- DataPointID: These datapoints can be either binary or analog and any value range. Just make sure to set the thresholds accordingly
- Icon: Icons that are shown together with the name and colored light in the facility cockpit. Any icon from fontawesome will work here.
- Alert category: Category that will aggregate different datapoints into the same alert. Alerta will not be happy if these contain spaces, so please don't try it.
- threshold_crit: Threshold, above (or below, if threshold_order is desc) which the alert will be triggered
- threshold_dead: The threshold for observations below (or above) which the datapoint is considered dead, offline, or broken.
- threshold_ok: The threshold for observations below (or above) which the datapoint is considered in correct state and any active alarm is reset.
- threshold_order: The order of the thresholds. 'asc' stands for cases where values above threshold_crit are critical, and 'desc' for the inverse. Example: indoor temperature above 30 is critical: threshold_crit=30, threshold_order=asc; And if temperatures below 15 are critical: threshold_crit=15, threshold_order=asc; 'asc' is automatically set if nothing is provided.
AI control page
In the following, the setup of the AI Control (controls cockpit) page of the web frontend is described.
⚠️ Warning |
If you made any major changes to your controls cockpit in the Excel sheet, be reminded to make use of the "Reset cockpit in project" button before setting the new values again. This is because when you press "Add cockpit to project", it only adds or updates the tags of the datapoints in your Excel sheet. This means that if you had set a datapoint in a previous version of the Excel sheet, and now want to replace it with a different one, only the new one will be updated, since the gui has no knowledge of previously set tags while adding a cockpit. So please, make liberal use of the "Reset cockpit in project" button, since it will be restored exactly the way you wanted to once you click the "Add cockpit to project" button |
Status Controls
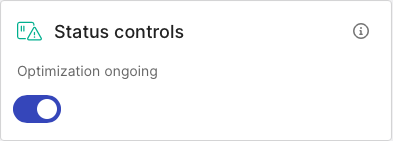
The status of controls in the project is automatically generated in the frontend by checking for active controls-apps via the API. You don´t need to do anything to activate this one.
Savings cards
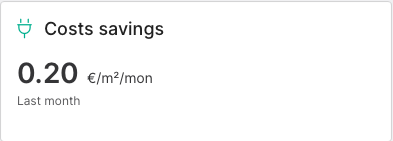
The cards show the values, units and time reference by getting the latest value of virtual data points that are identified by a certain tag with tag_key = controls_cockpit_savings and the following values. The placement of a value within the cockpit is automatically set by the value you set in the column "CockpitPlacement". These are identical to the tag_value naming convention described below.
For all three cards, the icon is
- green if the value >= 0
- yellow for a value < 0
Cost savings
- Title en: “Cost Savings”
- Title de: “Kosteneinsparung”
- tag_value = cost_savings
Emission Savings
- Title en: “CO2 Emission Savings”
- Title de: “CO2-Emissionseinsparung”
- tag_value = emission_savings,
Wellbeing improvement
- Title en: “Wellbeing Improvement”
- Title de: “Steigerung des Wohlbefindens”
- tag_value = wellbeing_improvement
The unit is automatically gathered from the datapoint´s "units" tag.
The time reference should be taken from the value of the tag with the tag_key = “time_reference”. It is a JSON with the available translations.
    {"en": ...,
    "de": ...}
Refer to this example which was created by importing this CSV file.
Schematic control loop
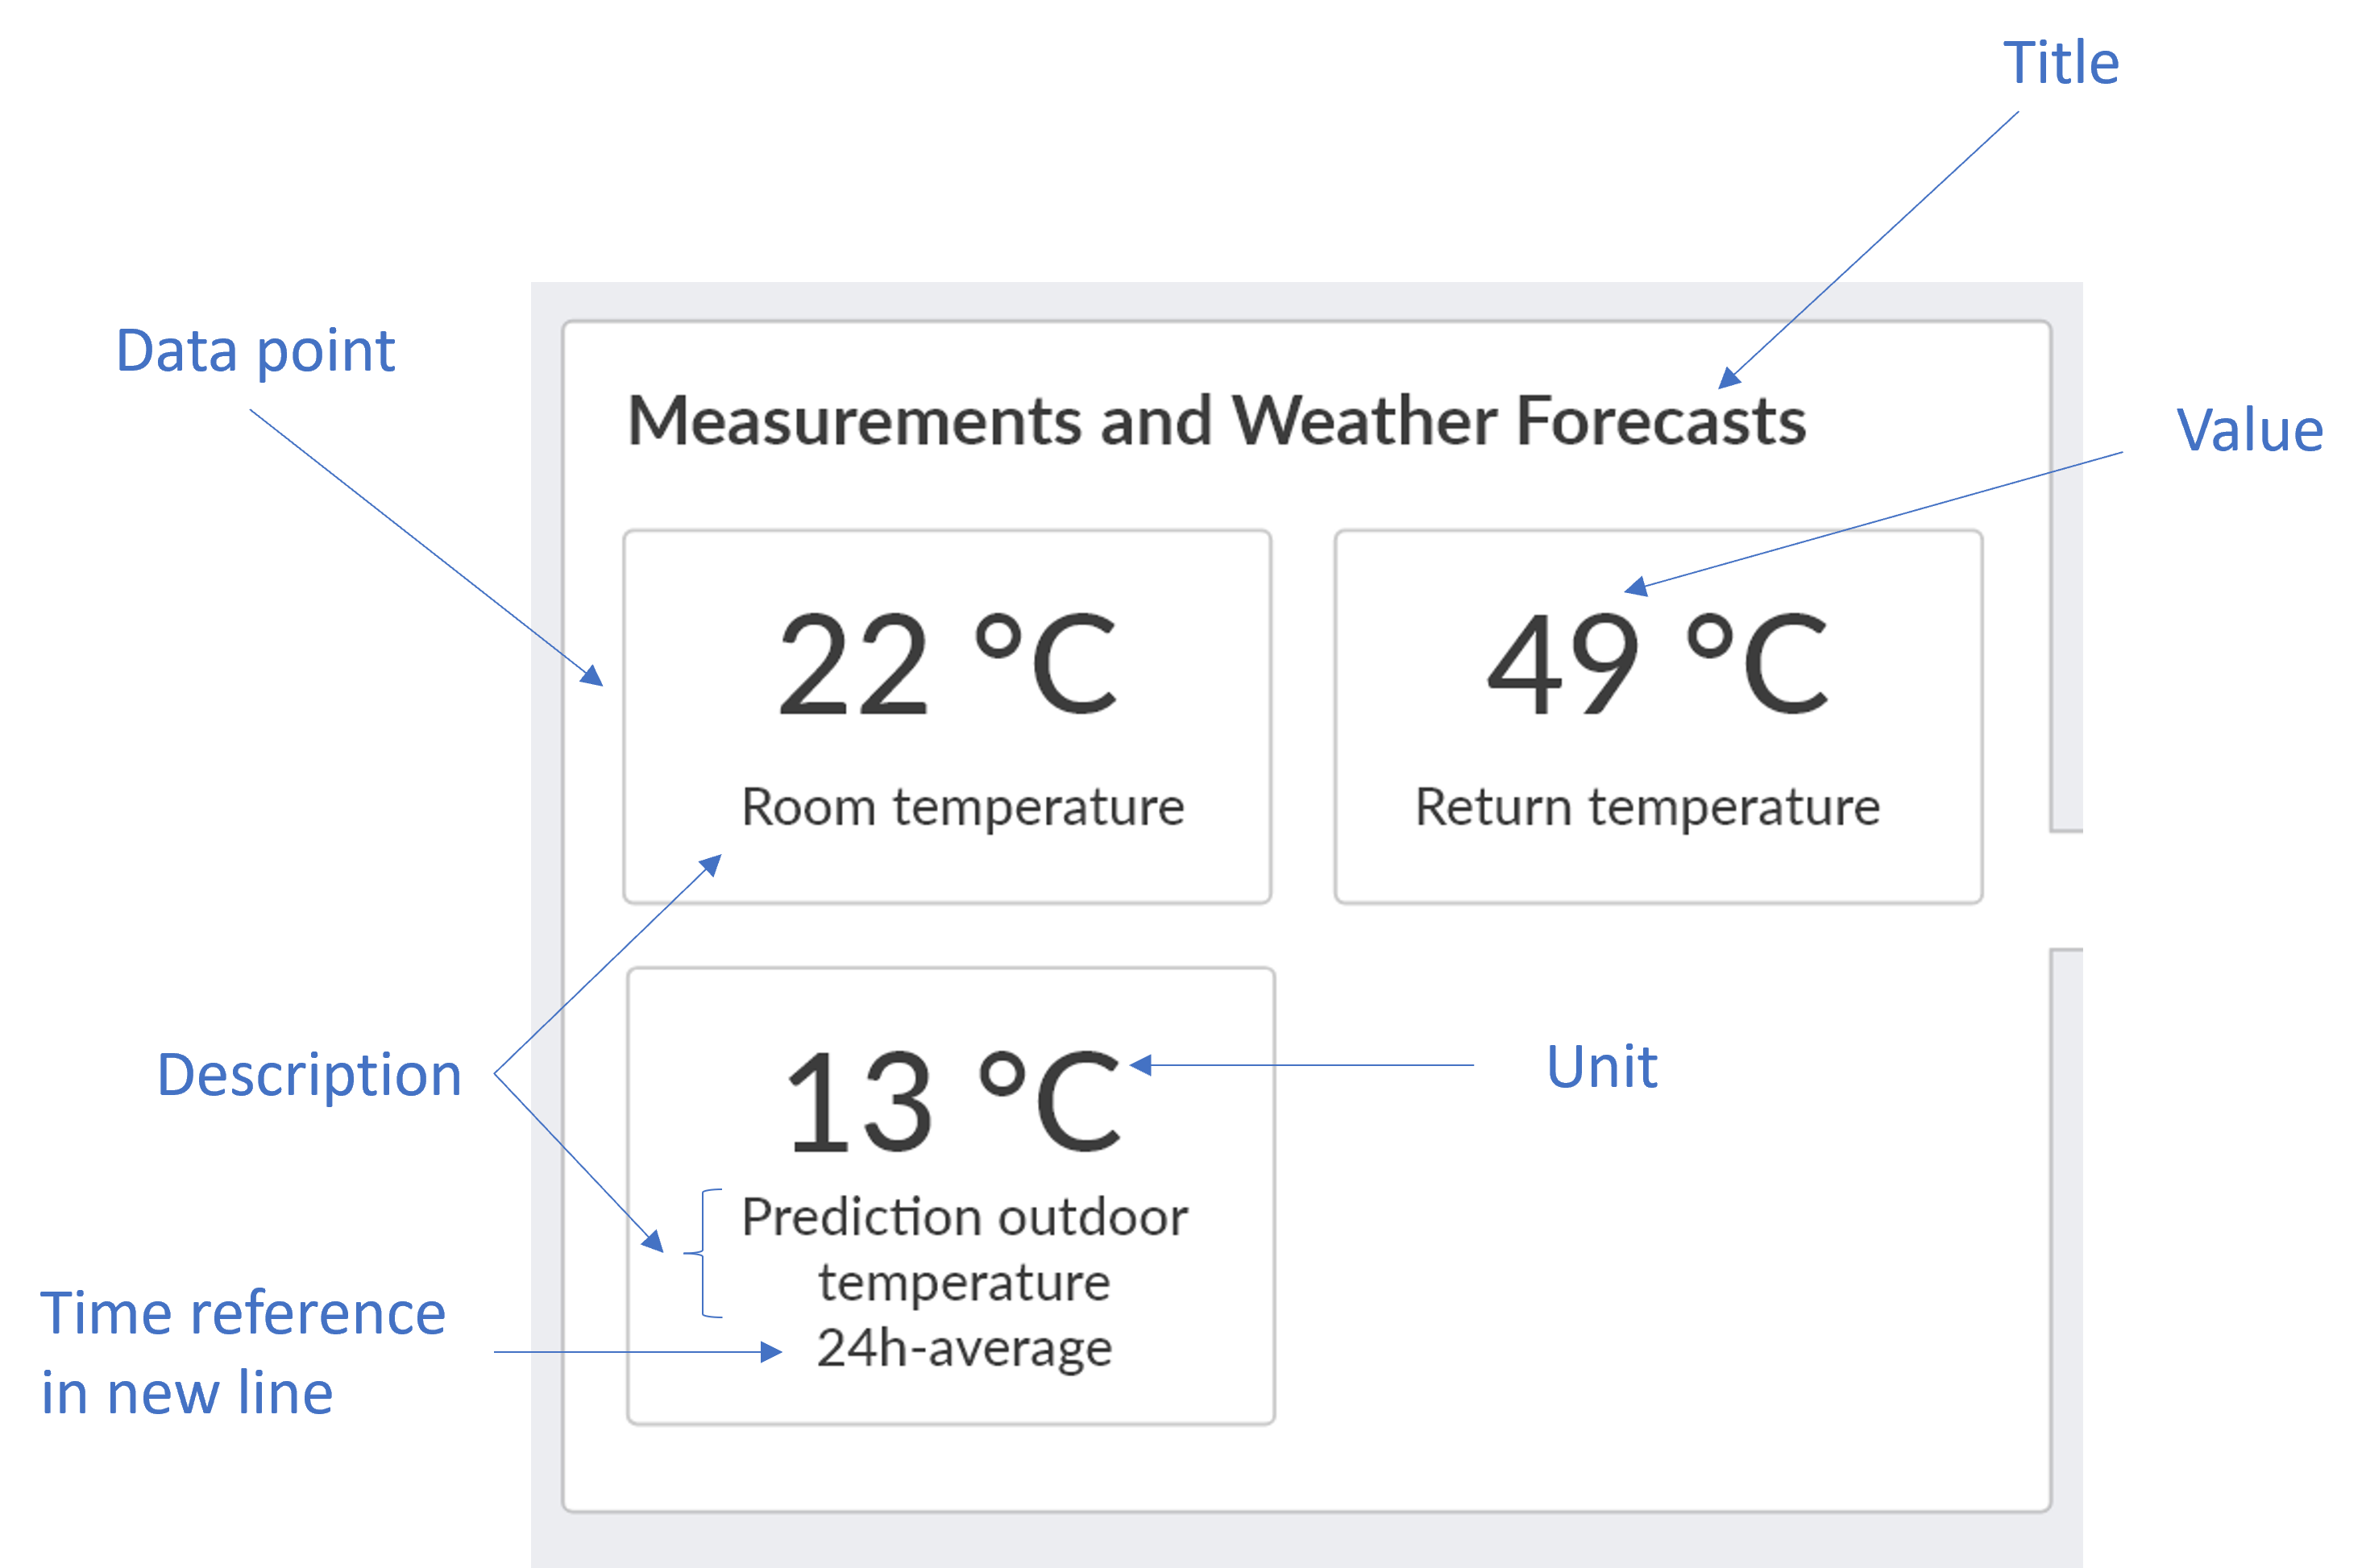
The current values are divided into three groups.
In each group, there should be a card showing the latest value of the (virtual) datapoint with a tag with the tag_key=controls_cockpit_current_values and the following values. The placement of a value within the cockpit is automatically set by the value you set in the column "CockpitPlacement". These are identical to the tag_value naming convention described below.
Group “Measurements”
- Title de: “Messwerte und Wettervorhersagen”
- Title en: “Measurements and Weather Forecasts”
- tag_value = ”measurements”
Group: Digital Twin Forecasts
- Title de: “Vorhersagen des digitalen Zwillings”
- Title en: “Digital Twin Forecasts”
- tag_value = “digital_twin_forecasts”
Commands
- Title de: “Stellbefehle”
- Title en: “Commands”
- tag_value = ”commands”
The description should be taken from the tag with the tag_key = "alternative_description". It is a JSON with the available translations
{"en": ...,
"de": ...}
The unit is automatically gathered from the datapoint´s "units" tag.
The time reference, which can often be omitted, should be taken from the value of the tag with the tag_key = “time_reference” It is a JSON with the available translations
{"en": ...,
"de": ...}
Here is an example of what the final Excel sheet for the controls cockpit can look like (the top row in the cockpit can not show additional names and the current_status also does not show a Unit or a time reference):
| Name DE | NameEN | DataPointID | Unit | TimeDe | TimeEN | CockpitPlacement |
|---|---|---|---|---|---|---|
|
| controls_cockpit_status_VDP |
|
|
| current_status |
|
| controls-monetary_savings_this_month_VDP | euro-per-square-meter-per-month | Letzten Monat | Last month | cost_savings |
|
| controls-emission_savings_this_month_VDP | euro-per-square-meter-per-month | Letzten Monat | Last month | emission_savings |
|
| controls-wellbeing_this_month_VDP | percent | Letzten Monat | Last month | wellbeing_improvement |
Raum 1 Sollwert | Room 1 setpoint | Dev207_Room1_Temp_SETPOINT_AO2 | degrees-celsius |
|
| commands |
Außentemperatur | Outdoor Air Temp | Dev101_Weather_Temp_ME_AI1 | degrees-celsius | 12 Stunden Mittelw. | 12 hour average | measurements |
Heizleistung | Heating Power | Dev901_CHP1_Thermal_Power_AI3 | kilowatts |
|
| digital_twin_forecasts |
- NameDE and NameEN: the names that are set in the frontend as the names for the system components
- DataPointID: Datapoint, whose current value is to be displayed in the controls cockpit. Can be any measured value or VDP.
- Unit: The unit that is to be shown in the frontend. The units HAVE be added here for datapoints that do not already have a unit tag. Datapoints without units will be displayed incorrectly in the frontend. This mostly applies to VDP, which are inherently unitless, but here you can easily add one. If you want your value to be displayed without a unit, add the unit "generic", which tells the frontend that there is a unit to be displayed, but its value is "" Any unit id from the aedifion labels will work here.
- TimeDE and TimeEN: The descriptions that are set in the frontend as the text companioning the measured values. They are intended to be specifications for time intervals over which a datapoint has been averaged, but may also be used otherwise.
- CockpitPlacement: Specify, where exactly the value is to be displayed within the controls cockpit. current_status, cost_savings, emission_savings and wellbeing_improvement may all only be set once, since there is no possibility to display more than one value in each of these.
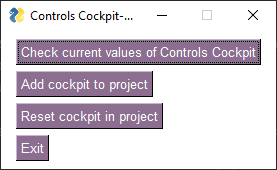
To add the controls cockpit from the gui, open the "Generate Controls Cockpit" menu. This contains the options to check the values of your cockpit, setting the cockpit on the server and resetting it if there are any problems.
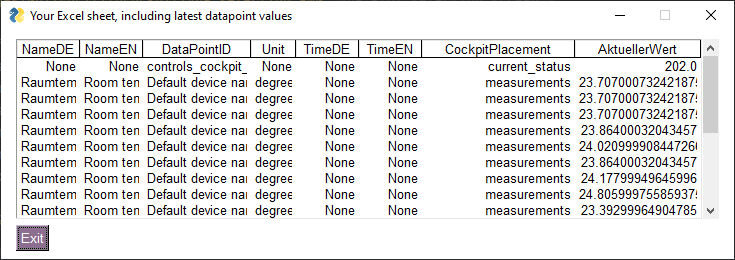
The "Check current values of Controls Cockpit" button will download the current values of your chosen datapoints and display them for you. This allows you to double-check if you picked the right datapoints, before you add the cockpit to the project. If you find any errors, make the changes in your Excel sheet and reload it in the gui by going back to the main menu.
If any problems occur after you have set your controls cockpit, you can easily reset it and upload it again. This will delete all relevant tags from the server (only the units tag will not be deleted), which leaves the controls cockpit blank once again. This will not delete any values or VDP, it will only remove their relevant controls cockpits tags.

