
Understanding Data Visualization and Aggregation
Why is an incorrect value shown for a long time?
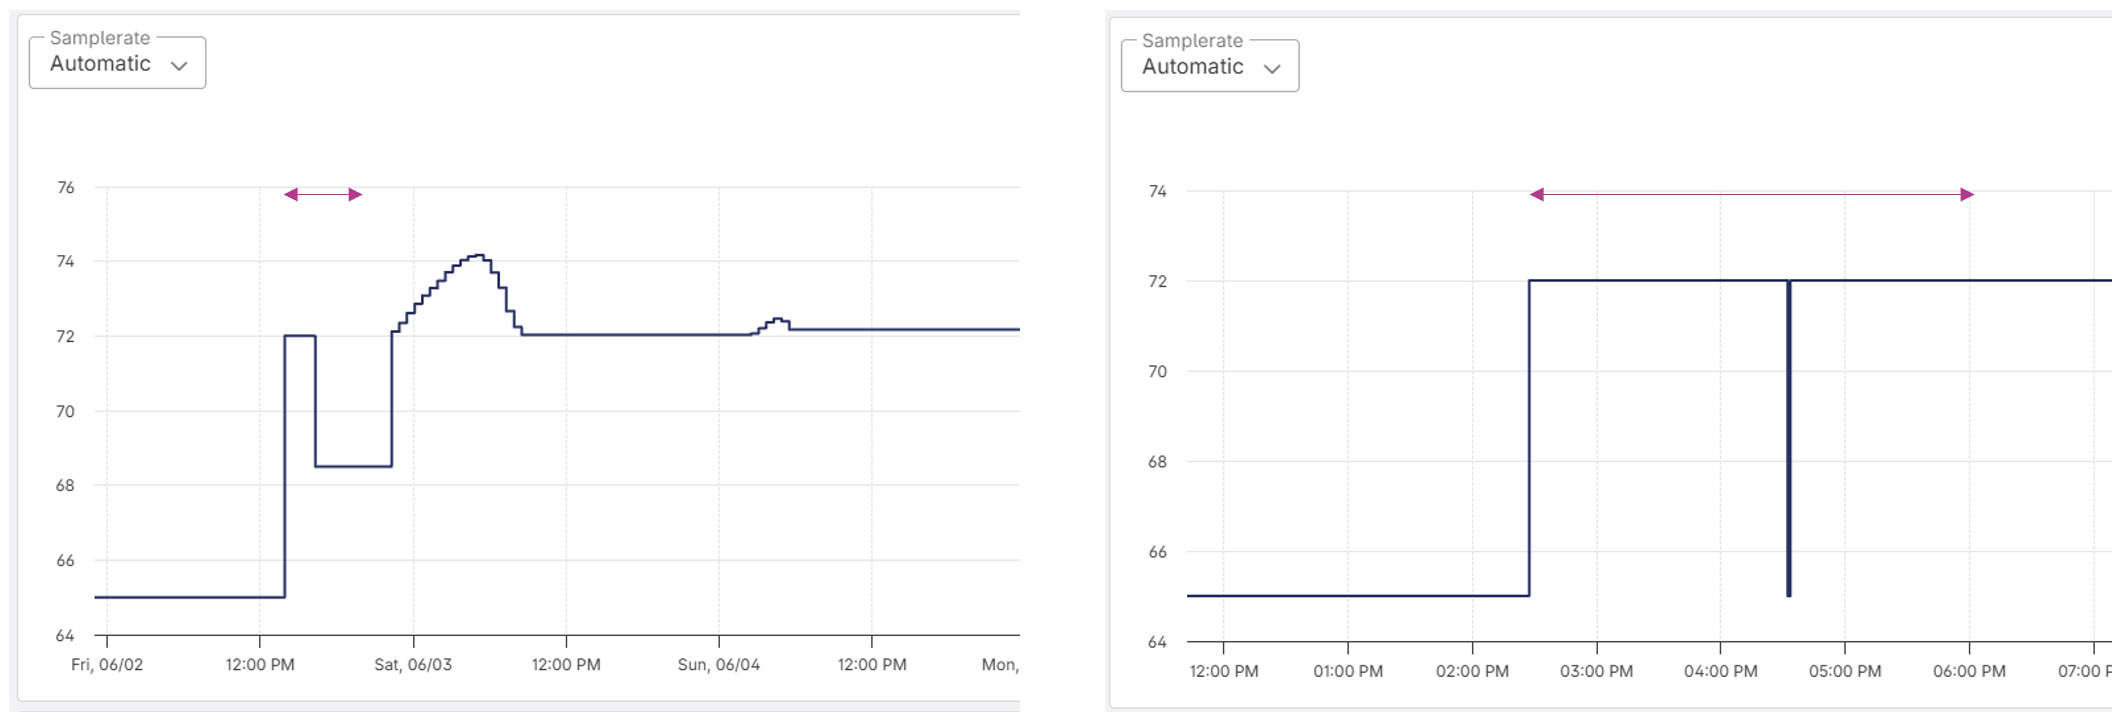
Sometimes, plots in our frontend contain inconsistencies, like this one. In this case, the zoomed-out view shows the value staying at 68.5°C for a few hours, but once you zoom in, you see that it only dips down for a very short time and then goes back up to 72°C.
How does that happen?
When viewing data over extended periods, the platform automatically aggregates data points into time groups to improve performance and readability. For a view spanning one week, the platform will aggregate data into time groups of approximately 1 hour. For each time group, a mean value of all measurements is calculated and plotted. If a group does not contain any measurements, the value of the previous group is used.
This can also explain unexpected behavior of datapoints that show values that normally should never be there. For example, if you are looking at a Multi-State-Value (a datapoint that switches between whole numbers [1,2,3,4...]), the mean value of a time group can result in a plotted value such as 2.5, because different measurements were aggregated.
In our example above, the inconsistency occurs in the following way:
- The two measurements of 65°C and 72°C fall within the same time group and result in the mean value of 68.5°C.
- Since the next time group contains no data, the previous group's value of 68.5°C is assumed to stay constant (the technical term for this is zero-order hold).
- The next measurement occurs at 22:30, which causes the mean value to be shown for a long time.
How we avoid this
The easiest way of avoiding this behavior is to ensure there is always a new measurement. For this, we set up our loggers to send out all measurements every hour, even if the values did not change.
This way, an incorrect value is shown for at most one hour before the next measurement value can overwrite it.
How to handle confusing plots
If the plot you are looking at contains data you find confusing, it might be because of an issue like this. To help you easily adjust the way the data is aggregated, we provide a dropdown for the sample rate (the size of the time groups).
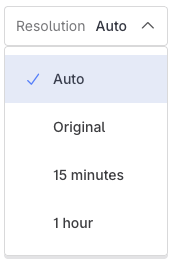
Automatic sample rate determines the size of the time group based on your selected time range. For one week, it results in approximately 1-hour time groups; for 1 month, approximately 4-hour time groups; and for 1 year, approximately 2-day time groups.
Original sample rate returns the full, unsampled dataset. This shows every individual observation without any averaging, so spikes and anomalies will be fully visible. Warning: this may include a very large dataset, causing long load times and potentially slowing down the plot. Avoid using this option for large time intervals or while many datapoints are selected.
Switching from the automatic sample rate to a fixed 1 hour or 15 minutes might improve the way the plot looks. If you are looking at a yearly plot, the mean value over 2 days can be very far off from the actual last value. So switching to a fixed sample rate might improve the visualization.