
Asset Overview
The Asset overview page is a reporting tool to increase value and achieve ESG goals:
- Energy cost
- CO₂ emissions
- Energy consumption
- Wellbeing
- Technical Availability
aedifion offers automatically generated recommendations to increase the efficiency and operating quality of technical building equipment. The following functions can only be used if the product aedifion.analytics is booked.
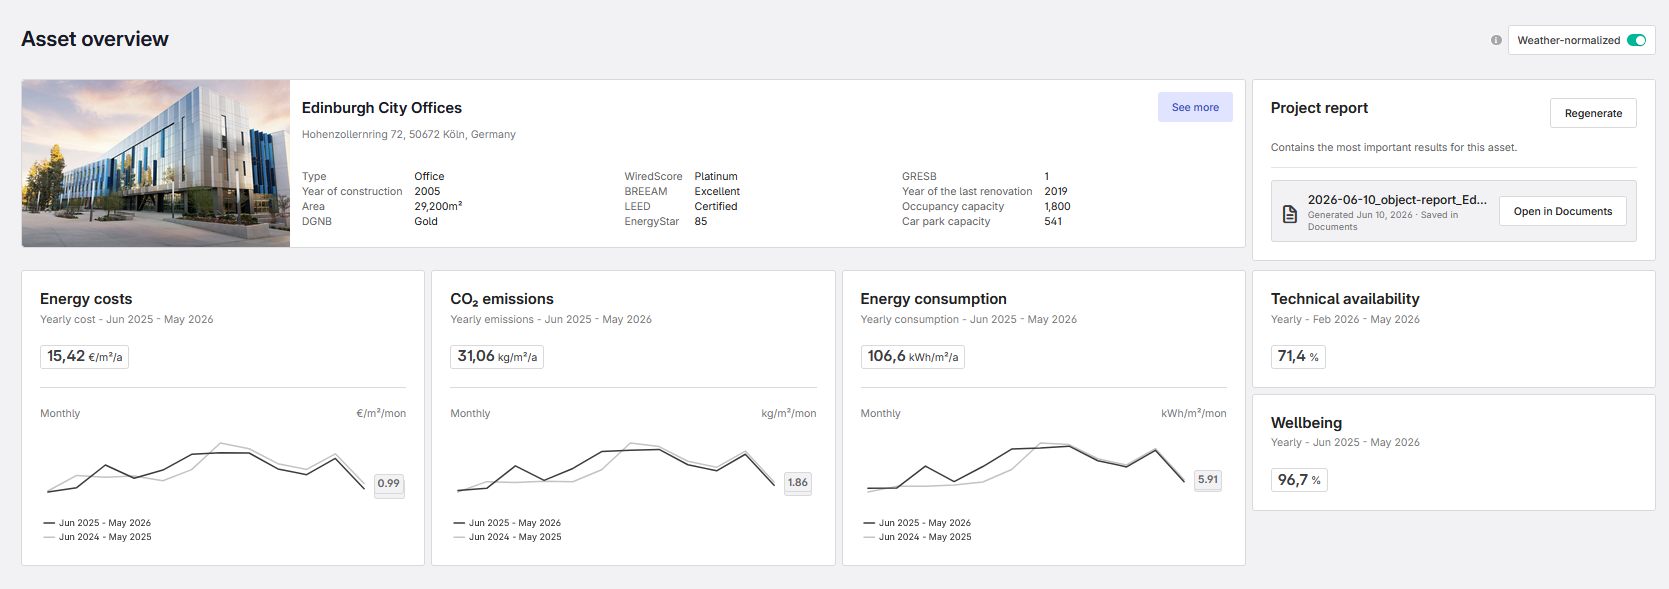
Figure 1: Asset overview page
Building overview
You will get an overview of the building with the data on the building type, net floor area as well as the status of certifications.
Project Report
A project report can be generated and opened here. It contains the most important results for the asset. Once generated, the report is saved automatically to the Documents section.
KPI Tiles
The following KPI tiles are displayed:
- Energy cost
- CO₂ emissions
- Energy consumption
- Wellbeing
- Technical Availability
The KPI values shown on each tile are yearly figures (based on the last 12 months). The accompanying plots present data on a monthly basis, comparing the current year against the previous year.
Energy, Cost, and Emissions Metrics
The metrics for annual, area-specific energy consumption, energy costs, and CO₂ emissions are based on meter data. The project's meters provide the data basis. The meters can be viewed and maintained on the meter page. The text above each value indicates the calculation method used. The methods are applied in the following order of priority:
- Yearly consumption
Used when at least one year of meter data is available. - Yearly consumption based on weather-normalized extrapolation
Used when less than one year of meter data is available. - Yearly consumption based on linear extrapolation
Used when methods 1 and 2 are not applicable.
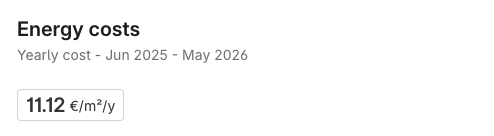
Figure 2: Annual, area-specific energy costs - Example using the calculation method 1
Weather normalization
Heating and cooling consumption depend strongly on the weather during the reporting period, which can flatter or hide real performance changes. Use this toggle to switch the displayed values between measured and weather-normalized consumption.
- The measured view shows what actually flowed through the meters and is the right number for billing or settlement.
- The weather-normalized view shows what consumption would have been under typical weather for the site, and is the right number for year-over-year comparisons, comparing different buildings, or judging whether an efficiency measure actually reduced consumption.
Only heating- and cooling-relevant meters are normalized; weather-independent loads such as plug loads or lighting are shown as-is in both views. For the full method and its assumptions, see the technical documentation.